


Visualization Letters
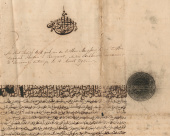
The diplomatic letters found in the Daily Journals of Batavia Castle cover a vast area and a long period in time. These many thousands of letters and hundreds of rulers and locations form a large set of data, which in turn is a unique example of the use of digital databases and software applications for the analyses of historical sources. Each letter has a source and destination location, which makes it possible to use the data for geographical mapping. The exchange of diplomatic correspondence between Batavia and the other locations can also be visualized. Visualization is an interactive tool which can be used in real time for viewing and selecting data. This will help researchers understand the scale and direction of diplomatic correspondence between Batavia Castle and the numerous local rulers scattered throughout Asia.
Interactive Nodegoat Environment for Diplomatic Letters Visualization
Use the embedded version below, or switch to fullscreen or editor
This visualization is created with Nodegoat, a data visualization product by LAB1100, the Netherlands.
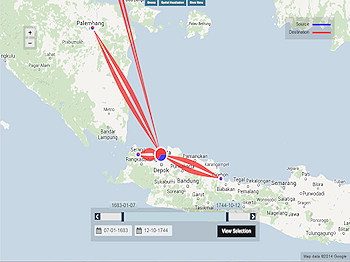
This visualization initially shows a world map (see: example left) which is used as a background to project the flow of diplomatic correspondence. This type of visualization is called a spatial or geographical visualization. By making a selection of data and processing the selected data, lines will appear between the locations from where letters were sent and Batavia. Selections can be made to focus on particular locations, regions, or even on certain kings and rulers.
Each letter has a date at which is was inserted in the Daily Journals. Using this date, it is possible to select a time period and to travel through time using the time slider.
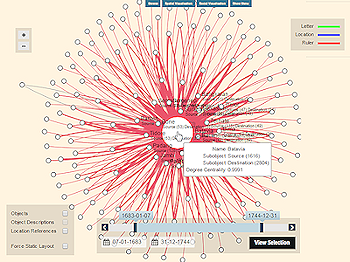
In case a particular location or ruler is selected, it is also possible to switch to a completely different view (see: example right) This view is called a “social visualization”. This shows the relationships between the selected location and the related location. If a related location has more diplomatic correspondence with the centre than others, then this is projected as being closer to the centre – not “closer” in geographical terms but in terms of social and political intercourse. One can travel in time or select a time period using the time slider.
This visualization only shows the incoming and outgoing letters to and from Batavia Castle. The dataset does not include manuscripts archived at locations other than Batavia Castle. One should be aware of the fact that there were multiple centres of diplomacy in the Asian world, and that this data set only depicts Batavia Castle as one of such centres. It is not suggested that it was the only centre of diplomacy. The lack of original archival manuscripts from other major diplomatic centres in the seventeenth and eighteenth centuries such as Surakarta (post-1746), Banten or Ayutthaya, makes it impossible to create similar data sets to the Daily Journals of Batavia Castle.